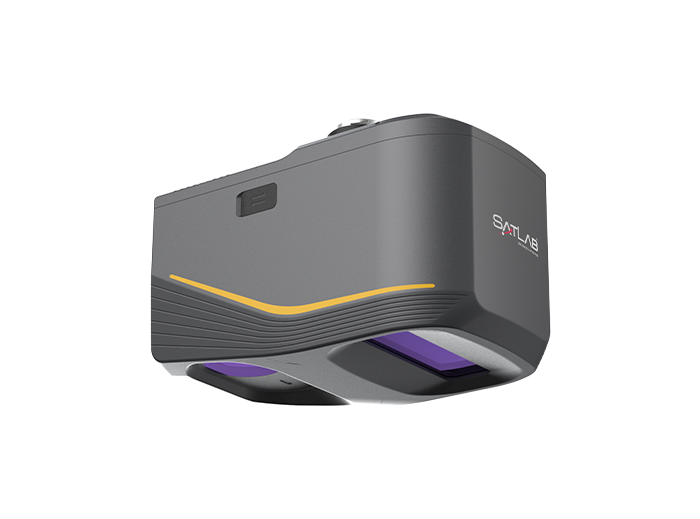
Debris flows are most frequent in summer and autumn. During this period, increased rainfall, heavy storms, and prolonged precipitation provide abundant water, triggering debris flow events.
In mountainous areas, ice and snow melt further contribute to the risk. Warmer temperatures lead to increased runoff, which destabilizes slopes and increases the likelihood of debris flows.
These events cause significant economic losses and pose serious threats to human safety and the environment. Conducting debris flow investigations helps understand their formation conditions, assess potential risks, determine suitable locations for mitigation projects, and protect local ecosystems.
Chengdu, Sichuan Province, China, the flood season brought multiple rounds of heavy rainfall. As a result, several geological hazard-prone areas were hit by debris flows.
Following local authorities’ requirements, a survey was conducted. The goal was to assess geomorphology, surface deformation, vegetation coverage, and hydrological features. This would help evaluate disaster risks, predict future changes, and support early warning and prevention efforts.
Figure1 Areas to be surveyed
Debris flows often occur in mountainous and canyon regions with complex terrain and unpredictable weather. These areas have poor accessibility and harsh environments, making traditional on-site surveys both risky and prone to errors.
The survey area consists of high-altitude forested mountains with dense vegetation. Data transmission may be affected by terrain constraints and interference, requiring advanced technical solutions and high-performance survey equipment.
The available takeoff points have a significant elevation difference of nearly 1,000 meters from the highest point of the survey area. A multi-rotor UAV carrying LiDAR must ascend at least 1,000 meters in a single flight to capture complete survey data.
Figure2 SatLab Apus-MX mounted on the DJI M350
Figure3 Flight plan of the acquisition
Apus-MX UAV LiDAR DJI M350 RTKCORS Network
Sat-LiDAR
Table 1 Apus-MX UAV LiDAR Specification
Figure4 Technical route
Figure5 Point cloud density
Figure8 DEM result
Figure6 Point cloud thickness
Figure9 DOM result
Figure7 Point cloud result
Figure10 Vegetation penetration effect